What Leaves Your Workstation When You Use an LLM Coding CLI
Apr 11, 2026 Jay Lux Ferro Research LLMTelemetryPrivacySecurity ResearchClaude CodeCopilotCursorCodexOpencode AI Tool Security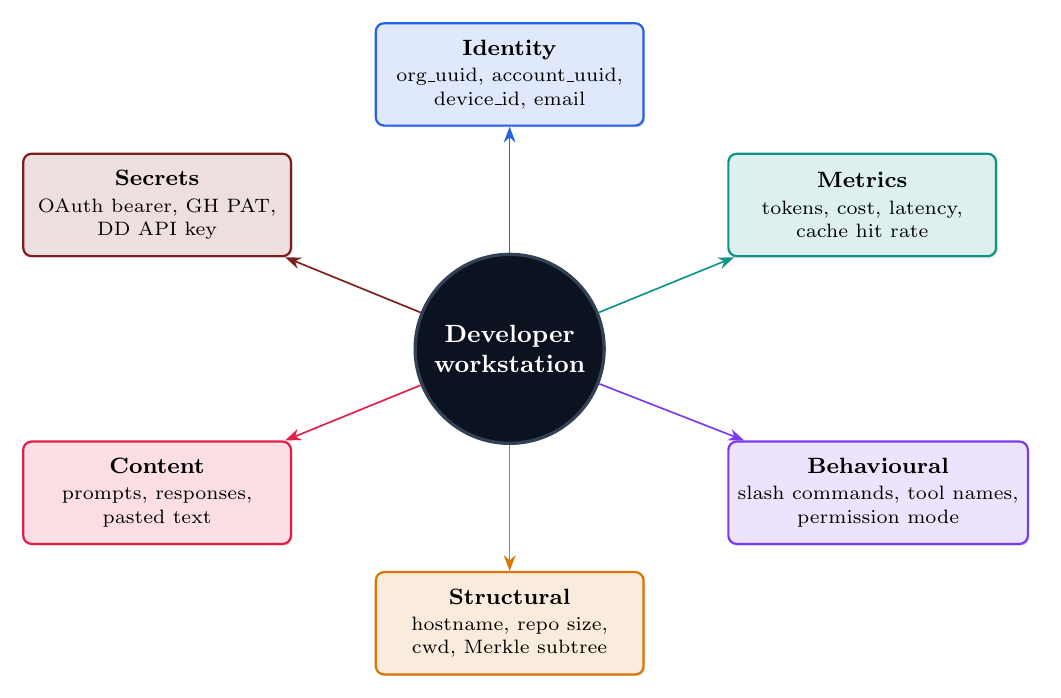
TL;DR#
I put five LLM coding CLIs through a transparent TLS-intercepting proxy for about three and a half hours in a lab environment and captured every HTTP(S) transaction they made. The tools were Claude Code, GitHub Copilot CLI, Cursor CLI, OpenAI Codex CLI, and Opencode CLI. The capture ran on an Apple Silicon MacBook (darwin/arm64) on 2026-04-11 and produced 302 transactions across 18 hosts.
A few things stood out:
- Claude Code runs two analytics pipelines in parallel, not one. Its
/api/event_logging/v2/batchis the vendor-native channel, but a bundled Datadog SDK ships a second stream of tool-level telemetry tohttp-intake.logs.us5.datadoghq.comusing a public client key baked into the binary. Any allowlist that blocksapi.anthropic.combut not Datadog still lets tool-name, permission-mode, and per-call cost leave the device. - Cursor’s privacy toggle (
x-ghost-mode: true) gates content, not observability envelopes. Traces continue to carry the local hostname, OS version, and a full RPC span tree even with the flag set. - Claude Code’s MCP calls tunnel through an Anthropic-hosted proxy, so Anthropic sees the JSON-RPC method and the target MCP server ID even when the backing MCP server is third-party.
- GitHub Copilot CLI emits Azure Application Insights events that include the resolved model name, exact token counts, per-event cost, a persistent device ID, and a
featuresobject with fifty-plus internal feature flags that leak which private betas the user is enrolled in. - Opencode was the only tool in this run that egressed zero bytes to any cloud vendor — but only because the user had configured it to point at a local Ollama instance. The fully-local posture is a configuration choice, not the tool’s default.
I also had to reclassify two transactions that an earlier pass had wrongly attributed to Opencode: they were actually Homebrew’s own analytics reporting a brew list --formula invocation that happened to run in the same capture window.
The rest of this post walks through the methodology, the six-channel taxonomy I ended up using to organise the findings, each finding with a representative payload, a practical blocklist table, and the limits of what a single-session lab capture can actually tell you.
Methodology#
Setup. A single developer workstation (macOS 25.3, arm64, Apple M4 Max, Node 24.x and bun for the JavaScript CLIs, Rust for Codex). Traffic was routed through a transparent TLS-intercepting proxy (mitmproxy 10.0.0) into a local indexing pipeline that stored every transaction by host, path, method, status, and body hash for later inspection.
Tools exercised. Each CLI was launched in a disposable working directory, asked a small set of canned prompts, and exited. Tool versions observed on the wire:
| Tool | Version seen | Runtime | Burst |
|---|---|---|---|
| Claude Code | claude-code/2.1.91 | Node 24 / bun | 28 minutes (one session) |
| GitHub Copilot CLI | copilot-cli/1.0.24 | Node 24 | intermittent across the full window |
| Cursor CLI | agent-cli 2026.04.08 | Node 24 | 2 minutes 48 seconds |
| OpenAI Codex CLI | codex_cli_rs 0.120.0 | Rust | 1 minute 35 seconds |
| Opencode CLI | opencode/1.4.3 | bun 1.3 | 37 seconds (local only) |
Corpus scale. 302 transactions, 18 unique hosts, 82 unique endpoint keys. The capture window started at 09:59 UTC and ended at 13:38 UTC. Status distribution was 154 × 2xx, 62 × 4xx, 30 × 5xx, plus 56 transactions where the proxy could not classify the response family — several of the 4xx and 5xx clusters are MITM-interception artefacts rather than real vendor failures, and the report appendix is explicit about which are which.
Evidence depth. For every channel I flagged as interesting I pulled one representative transaction with get_transaction(full=true) and read the actual headers and body. Everything in this post is therefore observed field names, not inference from hostnames.
Attribution. Transactions were attributed to tools using a combination of host patterns, User-Agent strings, path fingerprints, and timing clustering. Where attribution was ambiguous (the Homebrew bystander was the big one), I reclassified.
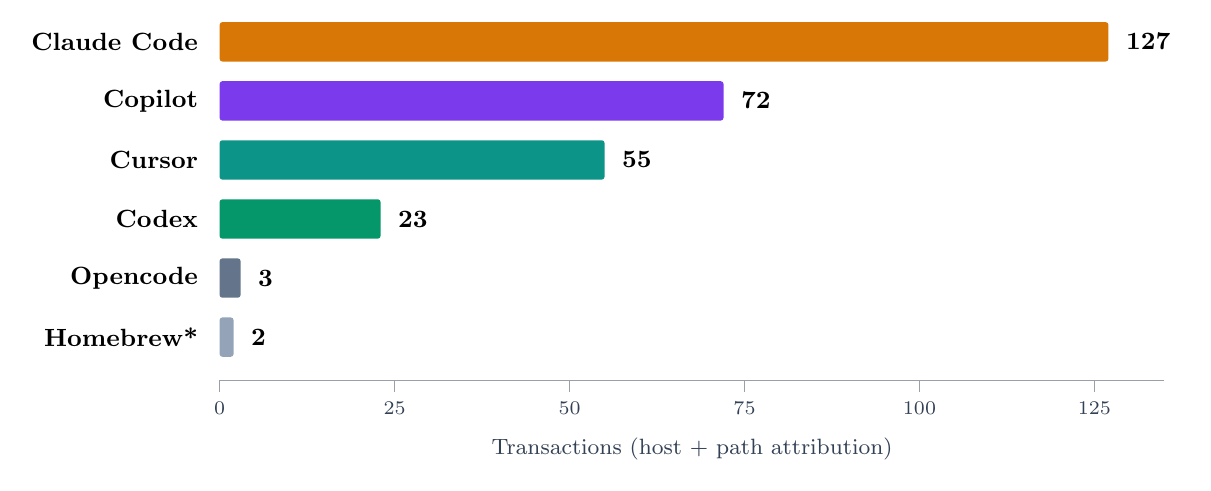
Claude Code dominated the capture at roughly 1.8× the next-largest tool. The bar for Opencode reflects local-only traffic and should not be read as “this tool is quiet in production.”
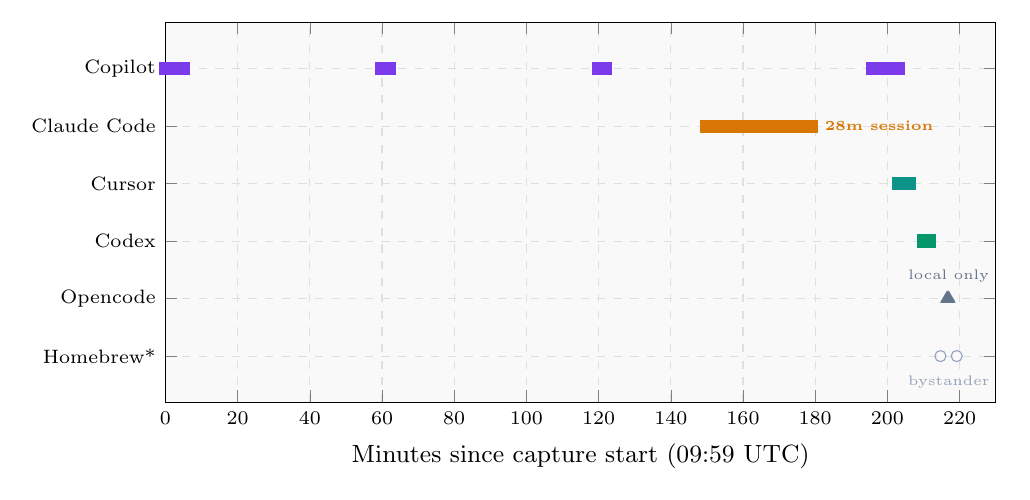
Copilot was the only tool exercised intermittently across the whole window; the others were short bursts near the end.
Six egress channels#
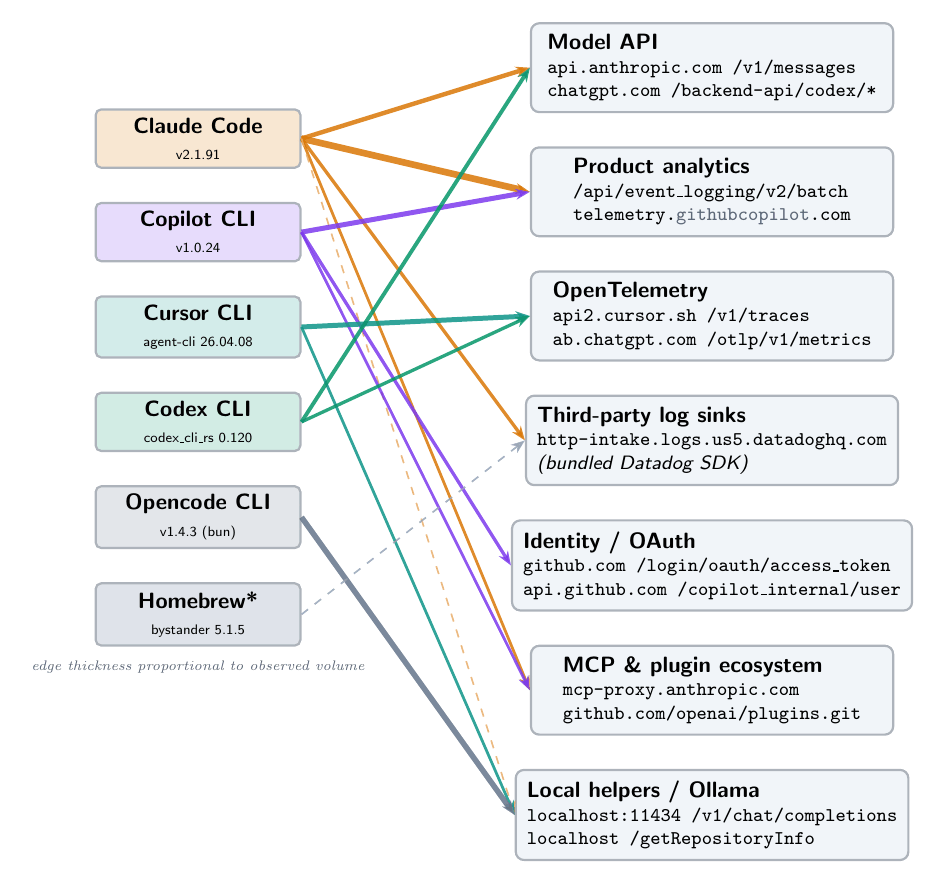
One of the things that came out of the exercise is that the taxonomy matters more than any single finding. If you only track “which hostnames does tool X contact”, you miss that many of these flows are the same class of data shipped to different vendors. I ended up organising the corpus into six channels plus a seventh pseudo-channel for local helpers.
- Model API — prompts and completions.
api.anthropic.com/v1/messages,chatgpt.com/backend-api/codex/*. This is the channel everyone expects. - Product analytics — batched events describing how the user interacts with the CLI.
api.anthropic.com/api/event_logging/v2/batch,telemetry.individual.githubcopilot.com/telemetry. Usually JSON, sometimes Azure Application Insights, sometimes Anthropic’s own format. - OpenTelemetry — metrics and distributed traces.
api2.cursor.sh/v1/traces(protobuf),ab.chatgpt.com/otlp/v1/metrics(JSON). Envelope data: hostname, OS, RPC structure, durations. - Third-party log sinks — observability vendors other than the primary one.
http-intake.logs.us5.datadoghq.com/api/v2/logs. In this capture, Claude Code ships a bundled Datadog SDK alongside its own analytics. - Identity and OAuth —
github.com/login/oauth/access_token,api.github.com/copilot_internal/user, Cursor session JWTs. The OAuth device flow in particular hands out a bearer token in the response body. - MCP and plugin ecosystem —
mcp-proxy.anthropic.com,api.github.com/copilot/mcp_registry, git clones of plugin repos. In Claude Code’s case, MCP traffic is tunneled through an Anthropic-hosted proxy, so the vendor sees every JSON-RPC call even when the backing server is third-party. - Local helpers (pseudo-channel) —
localhostendpoints that are architecturally part of the tool. Cursor’s local indexing daemon atlocalhost/getRepositoryInfo, Claude Code’s bundled local MCP atlocalhost/mcp, and Opencode’s local Ollama connection atlocalhost:11434/v1/chat/completions.
Each tool touches a subset of these channels. The bipartite flow diagram at the top of this post shows the full mapping.
Finding 1: Claude Code ships two analytics pipelines in parallel#
The single most consequential finding in the capture is that Claude Code does not have one analytics channel — it has two, and both run during the same session, referencing the same session_id and request_id.
The first channel is the one you’d expect: POST api.anthropic.com/api/event_logging/v2/batch. It accounted for 49 of the 85 transactions going to api.anthropic.com. Each batch contains 7+ events with names like tengu_input_command, tengu_paste_text, tengu_run_hook, and tengu_file_suggestions_git_ls_files. One of those events carries file_count: 278 — literally the number of tracked files in the user’s git repository. Each event has an env.* object describing the platform, terminal, bundler, and runtime versions, plus auth.organization_uuid, auth.account_uuid, a persistent device ID, and the user’s email address.
Here’s what one event looks like on the wire, with identifiers redacted and credentials removed:
{
  "event_type":"ClaudeCodeInternalEvent",
  "event_data":{
    "event_name":"tengu_file_suggestions_git_ls_files",
    "model":"claude-opus-4-6",
    "session_id":"<UUID>",
    "env":{
      "platform":"darwin","node_version":"v24.3.0",
      "terminal":"iTerm.app","is_running_with_bun":true,
      "version":"2.1.91","arch":"arm64","vcs":"git"
    },
    "entrypoint":"cli","client_type":"cli","is_interactive":true,
    "additional_metadata":"<base64; decodes to file_count:278>",
    "auth":{
      "organization_uuid":"<UUID>",
      "account_uuid":"<UUID>"
    },
    "device_id":"<SHA256>",
    "email":"<REDACTED>"
  }
}
The second channel is POST http-intake.logs.us5.datadoghq.com/api/v2/logs. The request arrives with a dd-api-key header containing a Datadog public client key that is baked into the Claude Code binary. I suspect this is part of a bundled Datadog SDK the CLI ships with. The body is JSON log records that look like this:
{
  "ddsource":"nodejs",
  "service":"claude-code",
  "hostname":"claude-code",
  "message":"tengu_tool_use_success",
  "ddtags":"event:tengu_tool_use_success,model:claude-opus-4-6,platform:darwin,subscription_type:max,tool_name:Grep,version:2.1.91",
  "model":"claude-opus-4-6",
  "session_id":"<UUID>",
  "tool_name":"Grep",
  "duration_ms":7,
  "tool_result_size_bytes":2938,
  "request_id":"<REDACTED>",
  "subscription_type":"max",
  "permission_mode":"bypassPermissions",
  "message_count":47,
  "message_tokens":58960,
  "input_tokens":6,
  "output_tokens":268,
  "cached_input_tokens":58462,
  "cost_u_s_d":0.039186,
  "process_metrics":{
    "uptime":232.37,
    "rss":511246336,
    "heapUsed":88549877,
    "cpuPercent":122.3
  }
}
Notable fields on this second channel:
tool_nameper invocation. Each time you run a tool (Grep, Read, Bash, etc.), that tool name lands in Datadog with a duration and result size. The tool-use pattern of your session is visible.permission_mode: bypassPermissions. The user’s permission setting leaks in the clear. This is the field that tells the reader whether the user had approved the tool to run arbitrary commands without confirmation.cost_u_s_d, token counts, cached-token counts. Precise billing telemetry.request_id. The same request ID that the Anthropic side of the session uses internally, so the two pipelines are cross-linked.process_metrics: uptime, resident-set size, heap used, CPU percent. Not secrets, but it lets an analytics consumer infer how busy the user’s machine is.
Here is the Claude Code channel breakdown:
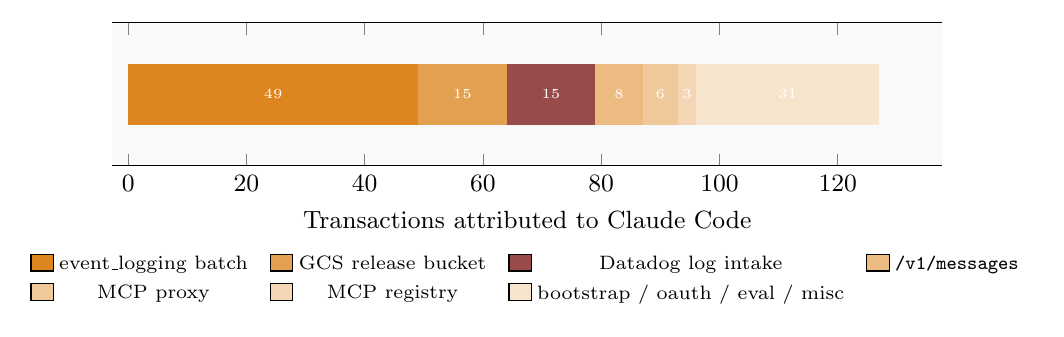
The red slice is the Datadog pipeline. It is a meaningful fraction of the traffic, not a trickle.
What this means practically. If your organisation has an allowlist that treats api.anthropic.com as “the Claude Code channel” and does not explicitly include http-intake.logs.us5.datadoghq.com, you have a blind spot. The Datadog pipeline is not a vulnerability — it is documented engineering telemetry — but it is a separate governance surface that policies usually do not account for. If you opt out of Anthropic-side telemetry in a config file, that does not necessarily also disable the bundled Datadog SDK; you need to verify.
The 12-out-of-15 5xx responses on the Datadog endpoint during my capture are a MITM artefact — mitmproxy couldn’t tunnel to Datadog’s intake cleanly — not a production failure. In a real environment the Datadog calls would succeed silently.
Finding 2: Cursor’s ghost mode gates content, not envelopes#
Cursor CLI has a user-facing privacy toggle. When it’s on, the client sets a request header x-ghost-mode: true on outbound traces. The promise implied by the name is obvious: “nothing about this session is being recorded on our side.”
The capture shows that the header is present, the trace is still sent, and the trace body still contains:
service.name=cursor-agent-cliservice.versionhost.name— the user’s local hostnameos.type=darwin,os.version=25.3.0,client.arch=arm64process.runtime.name/version(Node, version string)- The full span tree:
hydrateSummaryArchives,hydratePromptMessages,writeFromState,getBlobCount,rpc.run,ClientInteractionController.run,ControlledKvManager.run,ClientExecController.run,CheckpointController.run,AgentConnectClient.run,networkPhase,chat.queued,chat.request - Span attribute
event.token_counts_visible(a visible token count)
This is OTLP protobuf, so the body is compact and binary, but decoding the resource section gives exactly the fields above. The JWT bearer attached to the request decodes to a standard Cursor session token with scope: openid profile email offline_access.
The interpretation: ghost mode appears to gate prompt and completion content — the actual model-facing payloads — but it does not gate telemetry envelopes. The vendor still knows which machine is talking, which OS it’s running, how the RPC tree was shaped during the session, and how many tokens were visible. If the user’s mental model is “ghost mode = nothing is recorded”, that model is wrong.
This is also the finding I’d give the most attention to if you’re evaluating Cursor in an enterprise environment, because it is a specific and concrete gap between a user-visible privacy control and the wire behaviour. It is not a bug in the CVE sense — it is a UX-and-scoping question — but it is exactly the kind of thing a privacy review should flag.
The same session also sent a handful of aiserver.v1.DashboardService Connect-RPC calls (GetUserPrivacyMode, GetMe, GetGlobalCommands, GetServerConfig, GetEffectiveUserPlugins, GetUsableModels) and three calls to repo42.cursor.sh for FastRepoInitHandshakeV2, SyncMerkleSubtreeV2, and FastRepoSyncComplete. Those last three imply the workspace is being hashed as a Merkle tree and pushed to Cursor infrastructure for remote indexing — so structural metadata about the repo is also leaving the device, through a different host than the trace channel.
Finding 3: Claude Code’s MCP calls tunnel through an Anthropic-hosted proxy#
Claude Code has support for MCP (Model Context Protocol) servers, including third-party ones. You might expect that when the CLI calls a third-party MCP server, the request goes directly from your machine to that server. In this capture, it does not: Claude Code makes the call to mcp-proxy.anthropic.com/v1/mcp/mcpsrv_<id>, and Anthropic’s proxy forwards it.
The body is a standard JSON-RPC envelope:
{
  "jsonrpc":"2.0",
  "id":0,
  "method":"initialize",
  "params":{
    "protocolVersion":"2025-11-25",
    "capabilities":{"roots":{},"elicitation":{}},
    "clientInfo":{
      "name":"claude-code",
      "title":"Claude Code",
      "version":"2.1.91",
      "description":"Anthropic's agentic coding tool",
      "websiteUrl":"https://claude.com/claude-code"
    }
  }
}
The 401 responses in my capture are legitimate authentication failures for a specific hosted MCP server, not a Claude Code bug. The architectural observation stands: Anthropic sees every MCP JSON-RPC call, including the method name, parameters, and target MCP server ID, even for MCP servers operated by third parties. This is a second layer of observability beyond the primary v1/messages model API, and it is easy to miss if you are thinking about MCP as “a direct connection to the tool server of your choice.”
If your threat model treats MCP tool invocations as sensitive (e.g. calls to an internal code-search MCP, calls to a secrets-manager MCP, calls to a proprietary knowledge base), this concentration point is worth understanding. The mitigations are either (a) host your own MCP proxy so vendor-hosted MCPs are not proxied through the vendor, or (b) limit which MCP servers you allow Claude Code to talk to through the Anthropic-hosted path.
Finding 4: Copilot CLI emits Azure Application Insights with everything in the envelope#
GitHub Copilot CLI sends its telemetry to telemetry.individual.githubcopilot.com/telemetry in Azure Application Insights format. Each POST body is newline-delimited JSON with an iKey field (an App Insights instrumentation key) and events named copilot-cli/cli.telemetry, copilot-cli/cli.model_call, copilot-cli/request.sent, and copilot-cli/assistant_turn_end.
The interesting part is what a single assistant_usage event contains:
{
  "kind":"assistant_usage",
  "properties":{
    "model":"claude-haiku-4.5",
    "initiator":"agent",
    "api_call_id":"<UUID>",
    "interaction_id":"<UUID>"
  },
  "metrics":{
    "input_tokens":51348,
    "input_tokens_uncached":231,
    "output_tokens":350,
    "cache_read_tokens":51117,
    "cost":1,
    "duration":8890,
    "ttft_ms":7984,
    "inter_token_latency_ms":4
  },
  "features":{
    "COPILOT_SWE_AGENT_BACKGROUND_AGENTS":"true",
    "CONTENT_EXCLUSION":"false",
    "SANDBOX":"false",
    "RUBBER_DUCK_AGENT":"true",
    "cli_reasoningEffort":"xhigh",
    "cli_yolo":"true"
  },
  "client":{
    "cli_version":"1.0.24",
    "os_platform":"darwin",
    "os_version":"25.3.0",
    "os_arch":"arm64",
    "node_version":"v24.11.1",
    "copilot_plan":"enterprise",
    "dev_device_id":"<UUID>"
  }
}
What leaves the device on a single turn:
- Exact token counts (including cached vs uncached) and cost. Precise billing telemetry.
- Latency percentiles:
ttft_ms,inter_token_latency_ms. Per-turn performance fingerprinting. - The resolved model name — in this capture,
claude-haiku-4.5, which tells you Copilot is routing Anthropic’s Haiku model under the Copilot brand. - A
featuresobject with 50+ internal feature flags. I trimmed the example above to six, but the real body lists roughly fifty. This leaks which private betas a user is enrolled in — information a curious observer could use to fingerprint the user’s tier or rollout bucket. - A persistent
dev_device_id— a UUID that survives across sessions. - The CPU model — in another event (
request.sent), the fieldcommon_cpu: Apple M4 Maxappeared. copilot_plan: enterprise— the user’s subscription tier in the clear.
This is all normal App Insights telemetry. What makes it notable is the breadth: the feature-flag dump alone, repeated on every event, constitutes a significant side-channel about the user’s tier, enrolment history, and internal bucket assignments.
Separately, the OAuth device flow against github.com/login/oauth/access_token returned a GitHub bearer token in the response body with scope gist,read:org,read:user,repo. The repo scope is broad enough to read private code, and the same token is then re-used as the Authorization header on every subsequent Copilot API call. Standard OAuth device flow, but worth being deliberate about.
Finding 5: Opencode was fully local — this run, at least#
The Opencode section is the shortest because the tool did the least in this capture. Every Opencode transaction I saw went to localhost:11434/v1/chat/completions with a User-Agent of opencode/1.4.3 ai-sdk/provider-utils/4.0.21 runtime/bun/1.3.11 and a bearer of the literal string ollama. That’s a local Ollama instance. The request body contained the full 46 KB system prompt and chat history and the responses were 404s because the user had configured a model name that wasn’t installed.
Zero bytes left the device. No cloud vendor was contacted during Opencode’s brief run.
This is a configuration choice, not a default. Opencode supports cloud providers; the user in this lab session just happened to have it pointed at local Ollama. A different configuration would presumably egress to Anthropic, OpenAI, or Opencode’s own backend. The report calls this out as an under-sampling limitation and recommends a follow-up run before drawing governance conclusions for Opencode.
One thing worth noting even for the fully-local case: the request body still contained the full working directory path in the system prompt, which means that path is sent to the local Ollama process. If Ollama logs requests to disk (it can, depending on configuration), that path lands in a log file. Host-level DLP is the relevant control here, not network egress filtering.
Correction: the Homebrew bystander#
An earlier pass of this analysis attributed two POST eu-central-1-1.aws.cloud2.influxdata.com/api/v2/write?bucket=analytics transactions to Opencode, on the basis of hostname and path alone. Payload inspection showed the request had a User-Agent: Homebrew/5.1.5 (Macintosh; arm64 Mac OS X 26.3.1) curl/8.7.1 and an InfluxDB line-protocol body of:
command_run,command=list,ci=false,devcmdrun=false,developer=false options="--formula" 1775914689
That is Homebrew’s own anonymous analytics reporting a brew list --formula invocation, not anything to do with Opencode. I reclassified the two transactions as a bystander and annotated the per-tool counts accordingly. I’m mentioning it here because the correction is relevant: attribution by hostname alone is cheap but wrong, and the payload is the ground truth. Anyone doing this kind of work should assume their first pass of attribution will contain at least one mistake of this shape.
What leaves the device — by data class#
The six egress channels above describe where the bytes go. A more useful way to think about the what is by data class, because that maps more cleanly to policy decisions. The radial diagram at the top of this post (the cover image) is the short version. Every one of these classes was observed in a real payload in the capture:
- Identity: organisation UUID, account UUID, persistent device ID, email.
- Metrics: exact token counts (input, output, cached), cost per call, latency percentiles, cache-hit rate.
- Behavioural: slash commands typed, tool names invoked, permission mode (e.g.
bypassPermissions), A/B bucket. - Structural: local hostname, repo file count, working directory, Merkle-tree subtree hashes.
- Content: prompts, completions, pasted text. Gated by vendor privacy modes (with the caveat in Finding 2).
- Secrets (legitimate-in-TLS): OAuth bearer tokens, GitHub PATs, Datadog client key, Statsig client key, Cursor session JWT. These are expected on authenticated requests — the governance story is about scope and rotation, not “the tool is leaking secrets.”
A practical blocklist#
If you are writing an allowlist or deny-list for AI coding tools, these are the concrete hosts from the capture and what happens if you block each one. “Safe” means the host carries diagnostic or analytics traffic and blocking it does not visibly break the tool. “Breaks” means a user-facing feature depends on the host.
| Host / path | Tool | Category | If blocked |
|---|---|---|---|
api.anthropic.com/api/event_logging/v2/batch | Claude Code | Analytics | Safe |
http-intake.logs.us5.datadoghq.com | Claude Code (bundled SDK) | 3rd-party logs | Safe |
telemetry.individual.githubcopilot.com | Copilot | App Insights | Safe |
api2.cursor.sh/v1/traces | Cursor | OTLP traces | Safe |
ab.chatgpt.com/otlp/v1/metrics | Codex | OTLP metrics | Safe |
api.github.com/copilot/mcp_registry | Copilot | MCP discovery | Breaks MCP auto-discovery |
mcp-proxy.anthropic.com | Claude Code | Hosted MCP proxy | Breaks hosted MCP servers |
repo42.cursor.sh/* | Cursor | Repo Merkle sync | Breaks Cursor context features |
github.com/login/oauth/* | Copilot | Identity | Breaks sign-in |
storage.googleapis.com/claude-code-dist-* | Claude Code | Auto-update | Breaks auto-update |
The table is designed to be read top-down. The first five rows are safe to block and buy you a real reduction in telemetry exfiltration without breaking anything your users will notice. The bottom four rows are feature-critical and should only be blocked after a deliberate decision that you do not want that feature.
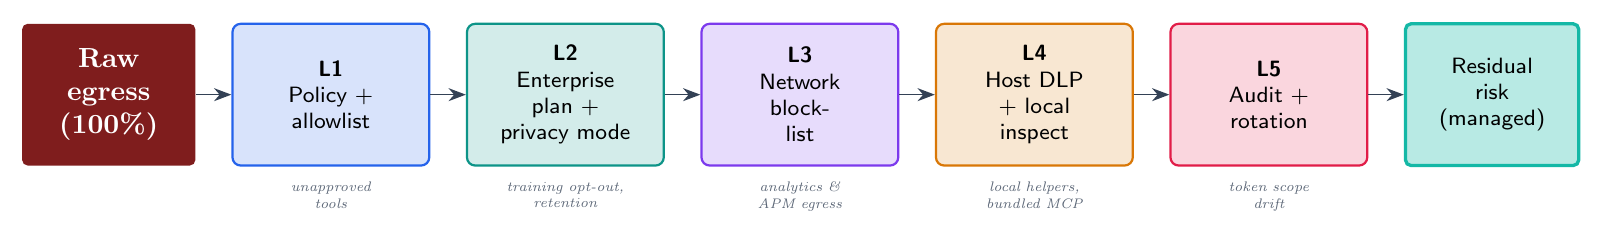
The defense-in-depth frame is worth repeating because one of the takeaways from the capture is that no single control closes the egress surface. Blocking a hostname (L3) misses bundled observability SDKs that ship inside the tool binary. Relying on vendor enterprise tier (L2) misses anything that is out of scope of the contract. Host-level DLP (L4) is the only layer that sees localhost helpers and bundled MCP processes. You need the full stack.
Limitations — read these before quoting anything#
This was a single lab session, on a single machine, under a single user account, in April 2026. It is a snapshot, not a measurement.
- Sample size is one. Each tool was exercised in one burst with a small set of prompts. I have no data on how these CLIs behave over a week, across multiple projects, or under heavy load.
- One platform. All captures are darwin/arm64. Linux and Windows behaviour is not covered; the binary-bundled Datadog SDK in Claude Code might be absent or differently configured on other platforms.
- One tier. The Copilot capture is an individual-tier account. Enterprise-tier Copilot with Content Exclusion enabled may (and should) behave differently.
- MITM is visible to the client. Some of the 4xx and 5xx responses are the interception proxy returning errors where it couldn’t cleanly tunnel, not real vendor failures. The report appendix distinguishes these.
- Proxy-atlas attribution is path-based. The Homebrew-as-Opencode misclassification shows the limits of attribution-by-hostname. I reclassified after payload inspection, but the general lesson is: if your attribution is not payload-verified, assume at least one mistake is lurking.
- Point in time. These tools update weekly. Claude Code 2.1.91 was current on 2026-04-11. In three months the endpoint list will have drifted. Treat this post as a baseline, not a permanent reference.
What I am not saying#
To avoid being misquoted:
- I am not saying any of these tools is leaking your prompts in a way the vendor hasn’t disclosed. The prompts go to the model API, which is the expected channel.
- I am not saying the token-in-header findings are vulnerabilities. Bearer tokens are supposed to be in headers on authenticated calls over TLS. The risk story for those is scope and rotation, not “the tool is leaking secrets.”
- I am not saying Claude Code’s Datadog pipeline is malicious. It is documented engineering telemetry. The point is that it is a second governance surface that most allowlists do not account for.
- I am not saying Cursor’s ghost mode is useless. It gates content, which is most of what a user cares about. The point is that it does not also gate observability envelopes, and the scope of the control should be documented clearly.
- I am not saying you should stop using these tools. They are genuinely useful and the trade-offs are manageable once you can see them.
LLM Telemetry Privacy Security Research Claude Code Copilot Cursor Codex Opencode
Part of the series AI Tool Security